

The Tools, Resources, and Prompts tabs only load data when the selected server
is connected. If the server is disconnected, the tabs clear any previously
loaded primitives and display a prompt to reconnect. Refresh, run, and read
actions are disabled until the server is connected again.
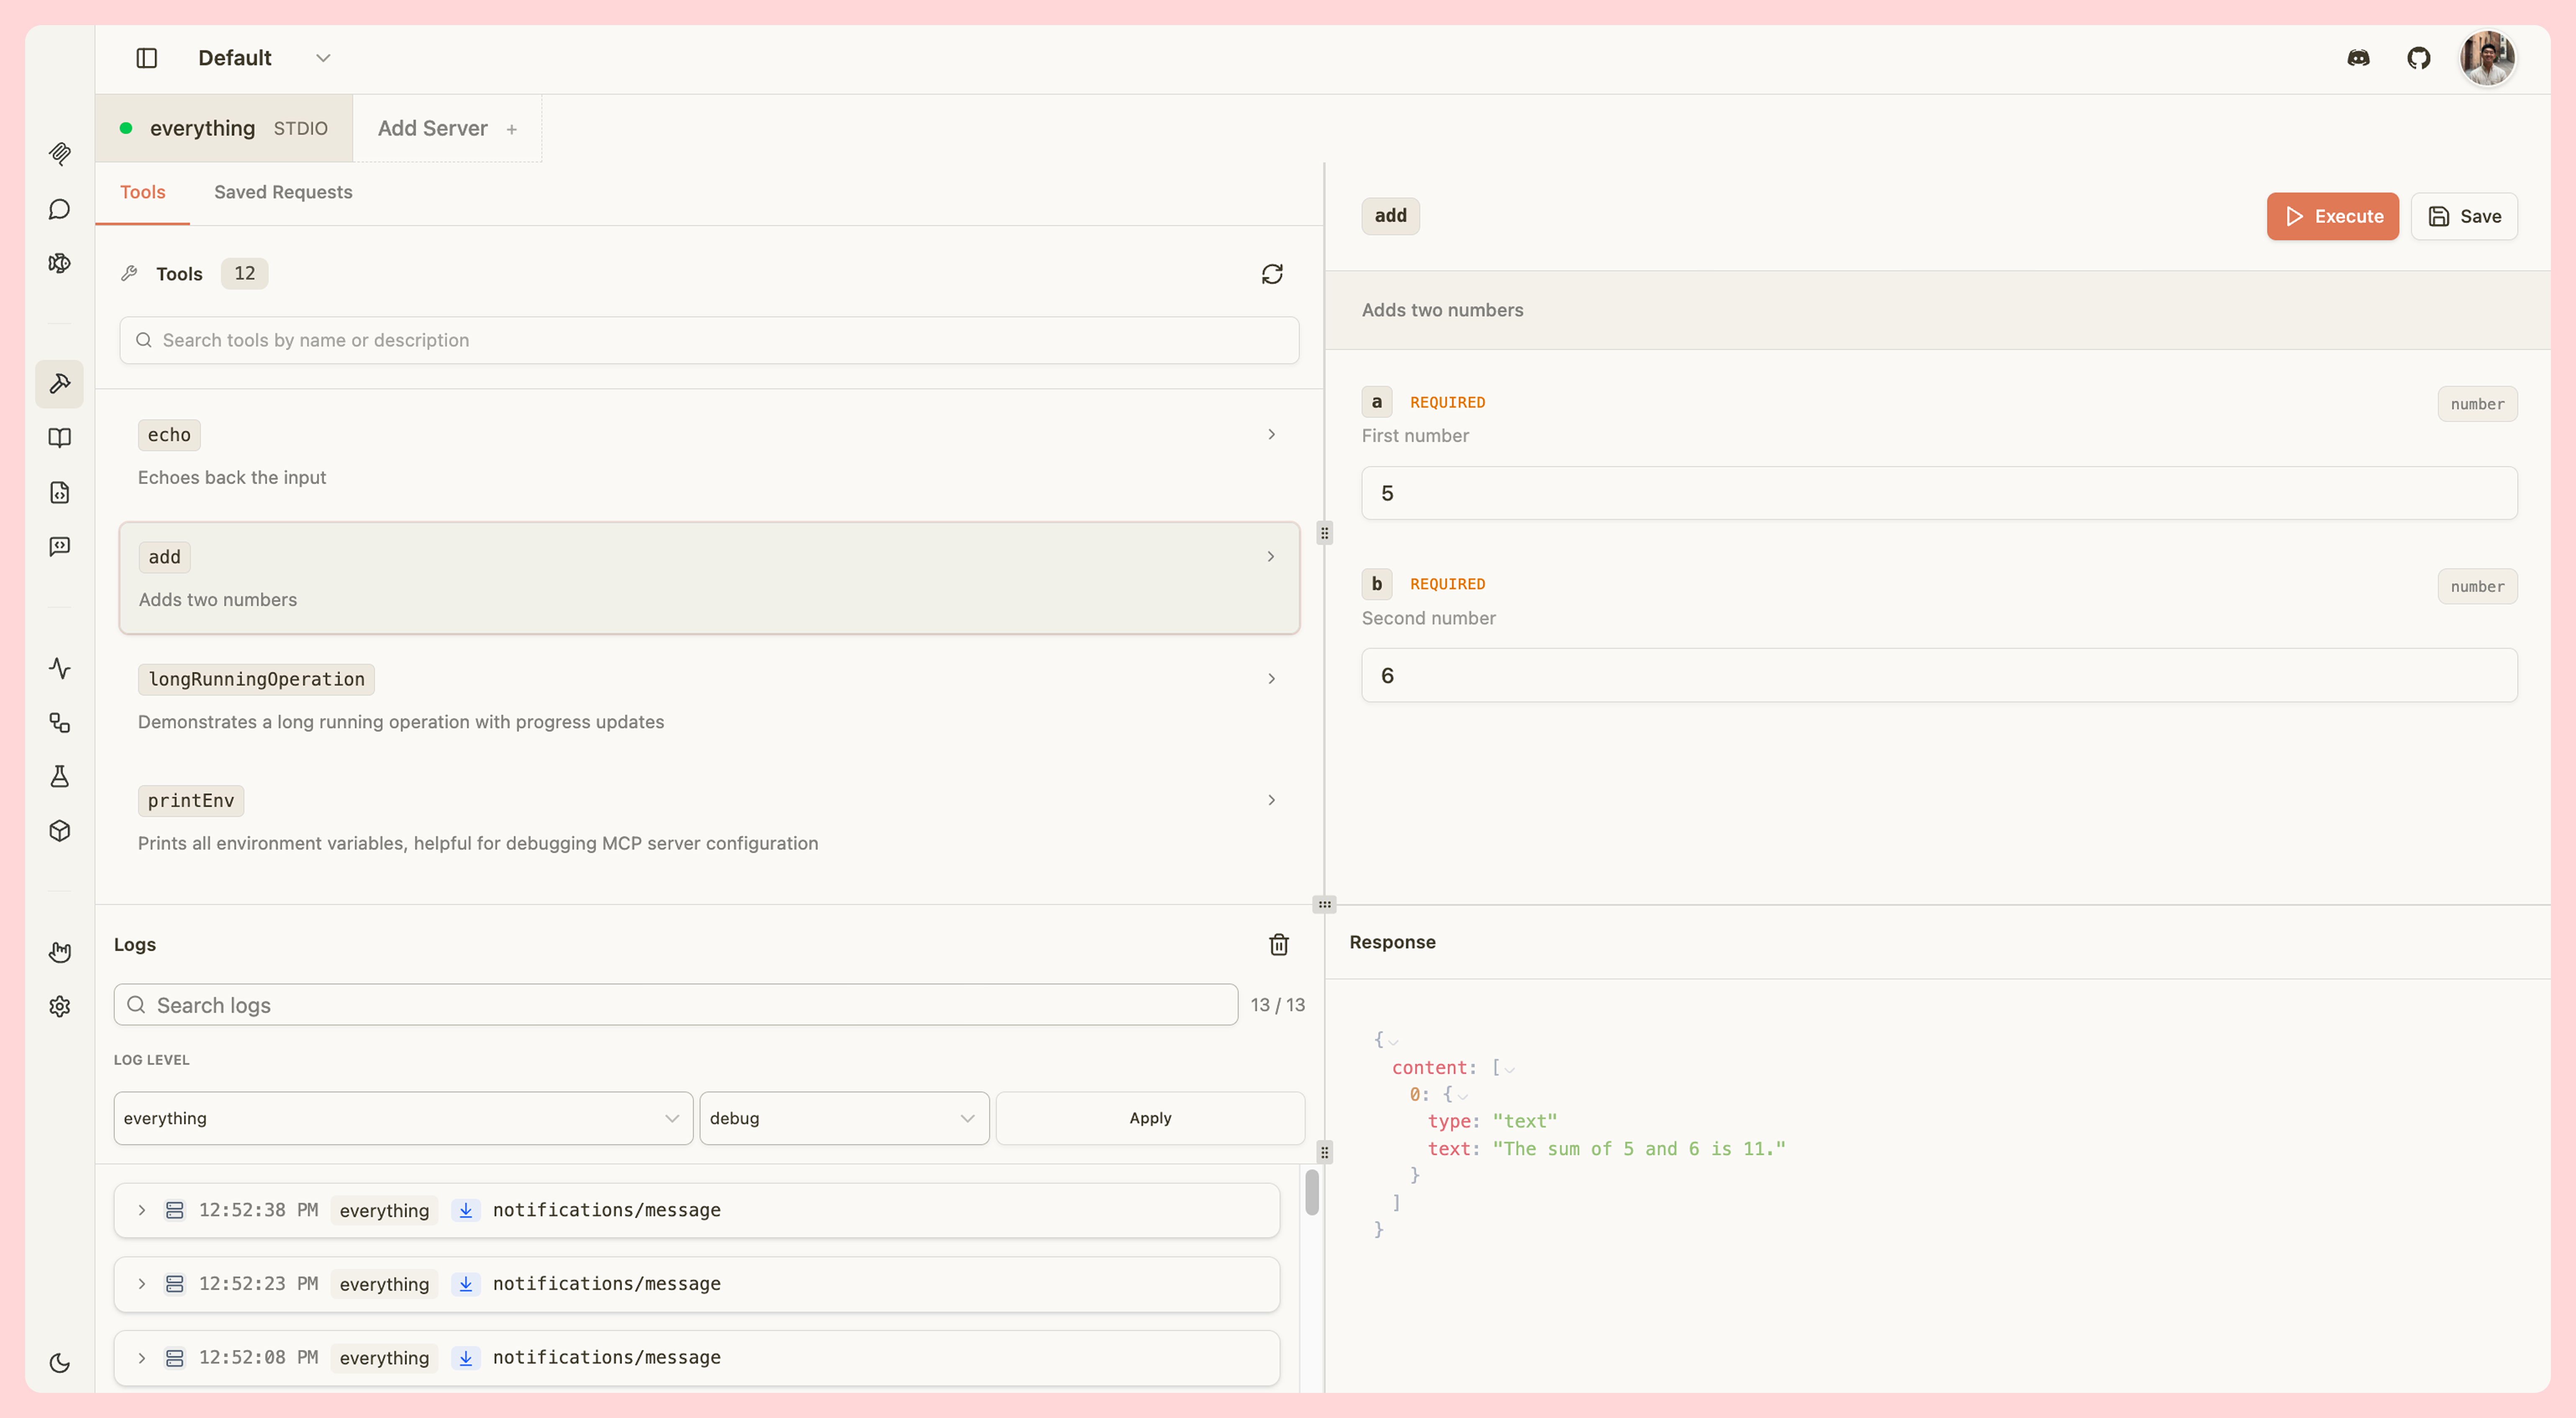
Tools
Test your MCP tools by manually invoking them with custom parameters:- View all tools - Browse tool names, descriptions, and parameters
- Search tools - Quickly find specific tools by name
- Invoke tools - Trigger tools with custom input parameters
- View results - See tool outputs, including widget responses for ChatGPT apps and MCP apps
- Elicitation support - Handle elicitation requests from tools
- Save requests - Save frequently used tool invocations for quick testing
Resources
Inspect your MCP server’s resources:- Browse resources - View all available resources with names, URIs, and MIME types
- Read resources - Fetch and view resource content
- Resource templates - Test templated resources with dynamic parameters
Prompts
Test your MCP prompts:- View prompts - Browse prompt names, descriptions, and parameters
- Fetch prompts - Retrieve prompt content with custom arguments
- Use in Playground - Type
/in the Playground to insert prompts directly into the conversation
JSON-RPC Logging
All communication between MCPJam and your MCP server is logged in real-time:- Request/response pairs - View complete JSON-RPC messages
- Message types - See tool calls, resource reads, prompt fetches, and more
- Error tracking - Inspect errors and validation issues
- Timestamps - Track message timing and performance
OAuth log entries
When a server uses OAuth, each step of the OAuth flow appears as a log entry in the traffic log alongside regular JSON-RPC messages. Use the Source filter dropdown and select OAuth to show only OAuth entries. Each OAuth log entry displays a status indicator:| Indicator | Meaning |
|---|---|
oauth ✓ | Step completed successfully |
oauth ✗ | Step failed |
oauth … | Step is in progress |
oauth ↺ | Step failed but was recovered (for example, after re-registering the client) |